Most of us can’t imagine life without our mobile phones. From a podcast on our daily commute to seeing who’s at the door when we’re not at home to last-minute holiday shopping, smartphones touch almost every aspect of daily life. Including how we go online. Since 2015, more people access the internet via mobile as compared to desktop or tablet, and in some locations use mobile at four times the rate of fixed access.
Yet many e-commerce companies still don’t give mobile equal treatment.
Not for long. As consumer trust in mobile shopping rises, faster checkout and payment options become available, and optimization increases, mobile commerce is poised to take center stage. In fact, a recent study by Business Insider Intelligence reports that by 2021, mobile commerce will catch up to e-commerce, accounting for about 45% of sales.
It’s time to give mobile commerce a seat at the table.
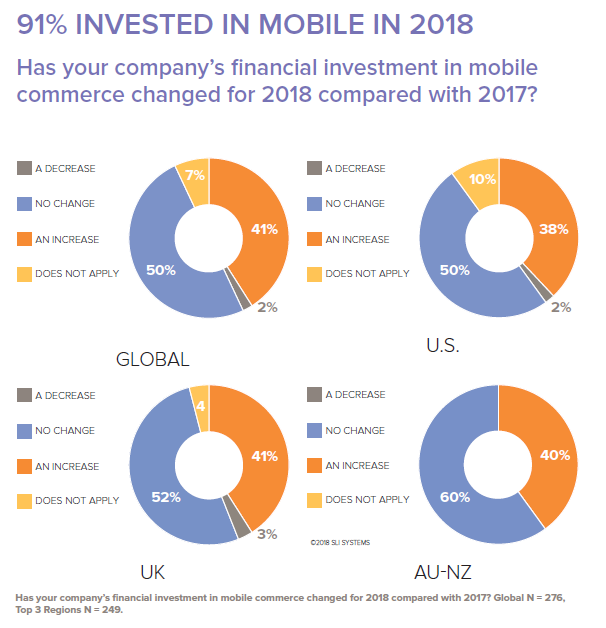
So how are e-commerce professionals preparing for increased mobile commerce? SLI Systems asked qualified retailers about it for our H1 2018 E-commerce Performance Indicators and Confidence (EPIC) Report. The results reveal considerable investment in mobile and high expectations for mobile-related revenue. Ninety-one percent of those surveyed report either maintaining (50%) their 2017 financial commitment or increasing (41%) their monetary investment this year, and almost all expect maintained or increased revenue.
It’s clear that when it comes to small-screen transactions, digital retailers are optimistic.
With only 1% of those surveyed foreseeing a drop in mobile revenue, e-commerce retailers are upbeat about growing consumer confidence in mobile site and app transactions. Eighty-one percent of retailers queried expect overall revenue increases from mobile sites and apps. And more retailers are expecting growth over 21% in the first quarter of 2018 compared to Q3 2017.
Investment in mobile is happening worldwide.
A look at the three most-represented regions in SLI’s EPIC Report shows close alignment in increased investments: 38% for the U.S., 41% for the UK, and 40% for the Australia-New Zealand region. And worldwide, more than half of those surveyed (54%) report an increase in the number of mobile initiatives and projects for 2018 compared with 2017, indicating retailers continue to anticipate consumer confidence in mobile site and app transactions will grow.
But regions vary in how they expect small-screen revenue growth to occur.
While globally retailers agree mobile is set to grow, there are geographic differences in predicted rates of growth. For example, when it comes to larger scale growth (over 21%), retailers from Australia and New Zealand are the most aggressive with 32% predicting larger revenue jumps for mobile site and app transactions. By contrast, 55% of U.S. respondents predict modest growth of 1-10% while that number remains closer to one-third in the UK and AU-NZ regions (35% and 32%, respectively).
Some industries are more focused on mobile than others.
SLI cross tabulated by industry to find out where retailers expect mobile to boom and where it will grow at a slower pace. Housewares / Home Furnishings leads the way in mobile investment with 65% reporting an increase related to mobile. Only 22% from Sporting Goods, by contrast, make similar plans. Representatives from Food and Beverage expect the biggest jump in small-screen revenue with 95% of respondents predicting an increase, while retailers from Sporting Goods and Media / Publishing were the least optimistic of the top five industries, with 78% and 63%, respectively, predicting an overall mobile site and app revenue increase.
Digital retailers can’t afford to ignore mobile commerce.
It’s clear that mobile will play a large role in the future of digital commerce. What was once e-commerce’s biggest challenge is quickly becoming it’s largest asset. And the rapid growth predicted for mobile commerce means retailers need to prepare now or face getting left behind.
For more on the latest trends in mobile commerce initiatives and revenue, click here to download the H1 2018 EPIC Report.


