


Your e-commerce business is full speed ahead. But that’s not good enough. You’ve been tasked with higher and higher growth expectations.

And now you have even more at stake. You are likely spending more and more to drive traffic to your site. You can’t let that big investment in advertising fizzle with diminishing ROI.
Good news. You have a high-impact driver you can execute against right now.
Improvement to your conversion rate is the greatest lever at your disposal. Even a small conversion rate increase can generate big revenue gains.
This comprehensive guide to e-commerce conversion rates helps you build a winning game plan for your online store, including:
- What e-commerce conversion benchmarks to use
- How to analyze your conversion rate
- How to optimize 7 critical conversion rate drivers
Let’s start by understanding how you can best measure conversion rate.
What is a good e-commerce conversion rate?
Online retailers track many conversions throughout their customer experience. Any action goal can be considered a conversion. A click on your email, a click on an advertisement, or a newsletter signup are considered conversions.
The conversion metric you really want to focus on is a purchase. Your sale conversion rate is calculated by simply taking the number of purchase transactions and dividing that by the total unique visitors to your online store during a time period.
That’s pretty straightforward. But what is a good conversion rate to set as your target goal?
This 2017 holiday shopping to date, average e-commerce conversion rates are showing growth: desktop 4.5% (up 10.6% YoY), smartphone 2% (up 12.3% YoY), tablet 4.3% (up 9.3% YoY), according to Adobe Digital Insights.
And Amazon boasts an amazing 74% conversion rate for its Prime members and 13% for non-Prime visitors back in 2015, based on a Millward Brown Digital study. In comparison, the same study showed the average conversion rate for Top 500 merchants is 3.32%.
Are those the right conversion rate benchmarks for you? Probably not.
It is interesting to set an aspirational goal against Amazon or other leaders that compete in your industry. However, you are best served by benchmarking where your own store is now. Then set a course for continual improvement to drive conversion optimization goals and strategies.
Measure your overall sales conversion rate for your entire website the past year. That’s your starting point. That’s the number you want to beat in 2018.
Then the key is to drill down into your sales-rate performance for different contributing factors and customer segments. That’s where your actionable insights really happen.
Now let’s explore the best way to analyze your conversions to enlighten your growth plans.
How You Can Analyze Your Conversion Rate
Conversion rate is a very useful metric to track. But the real impact to your e-commerce business is analyzing and understanding what is driving your performance and why.
That deeper conversion analysis helps you:
- Determine what segments are contributing to your overall conversion rate
- Identify the root causes
- Prioritize and track success of your optimization game plan
The first step is to build a dashboard that tracks and trends your conversion rate. Google Analytics and many e-commerce platforms provide a dashboard that lets you see your conversion rate over different periods of time.
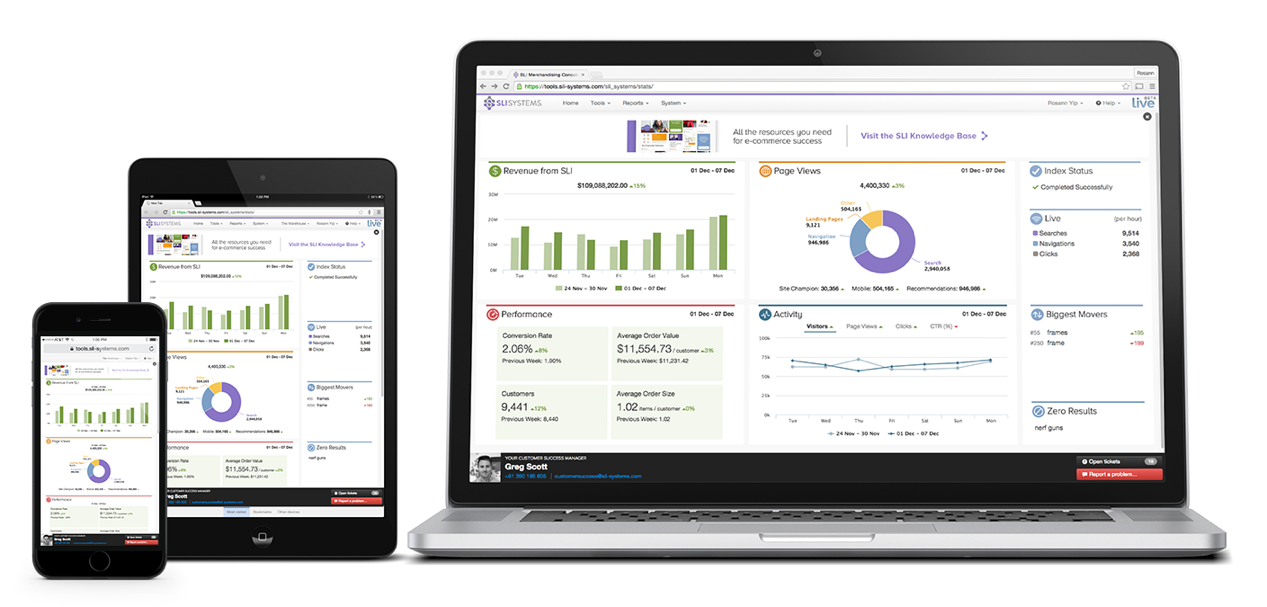
SLI Systems also has a very powerful dashboard built into the Commerce Console. You get an helpful view of your shoppers’ activities and conversion rate through their shopping journey.
Or you can simply use a spreadsheet. Capture your monthly unique visitor metrics and plug in your corresponding sales transaction data to calculate your conversion rates. Again, simply divide transactions by unique visitors to get the conversion rate percentage.
Next you’ll start the drill down analysis.
What Is Driving to Your Conversion Rate?
Your overall conversion rate calculation is an average. Many different factors drive that single number. Some factors contribute significantly more than others. It’s your job to break down those key drivers to find growth opportunities.
Start by segmenting your conversion rate data into categories.
The most common way to split up your data is by different customer audiences. Different types of customers have a different relationship with your e-commerce business. They may also have different purchase intent, which directly impacts your conversion rate.
Your analysis can uncover those segments that likely have differing intent to purchase. Then you can calculate the conversion rate for each segment. And you’ll see which audiences have the greatest influence on your overall conversion rate.
Here are several helpful ways to segment your audience.
- First-time visitors vs. returning visitors – First-time visitors often make up a big majority of online traffic. But it stands to reason that those first-time visitors who may be unfamiliar with your brand are less likely to purchase than returning visitors.
- Acquisition channel – Where visitors come from can help tell you how likely they are to buy. Segment by channels like organic search, paid search, social media, advertising, and affiliates.
- Device – The device visitors use may indicate different intent as shown in the Adobe data insights mentioned earlier.
- Location – Are you a global brand or do you sell domestically? Traffic coming from different international locations may be browsers, not buyers.
- Other demographics – Google Analytics can help you analyze other demographics like gender, age, or interest affinity groups.
Other popular segmentation you can use to uncover key conversion rate drivers include:
- Product category – Conversion rates may be higher for different products based on the volume sold, price range, or deliverability. For example, you would expect the online conversion rate to be lower for expensive furniture than easily shipped lower-priced home decor.
- Promotions and seasons – Different discounting periods or traditional shopping seasons may affect conversion rates.
- Website elements – You can track conversion rates by different elements of your customer experience.
Make sure you look at your conversion rate over time. Don’t just take a single snapshot in time to make your decisions. A single data point or particular shopping season can skew what you see and may lead you to incorrect decisions.
Calculate your segmented conversion rates into monthly or weekly increments. Go back in time as far as you can. Then you can chart trends and make year-over-year and month-over-month comparisons.
Starting with one segmentation method is also recommended. Add that to your dashboard. Keep tracking that segmented data to see how you are performing. Then expand your analysis to other segment categories.
Your conversion rate analysis helps you find your growth opportunities. But it doesn’t tell you exactly why those different segments are performing the way they are.
Why Is Your Conversion Rate Increasing (or Decreasing)?
Now you can dig a little deeper to understand why your conversion rate is increasing or decreasing. Find the root cause by adding a second dimension to your analysis of a particular segment category.
What is the behavior or characteristic about a given segment that is likely causing sales to go up or down?
The best way to do this is to add one of the other segment categories as that additional dimension. For example, if your primary segmentation is based on acquisition channel, then you can drill down using product category purchased or device used or location demographics.
Analyze that data. Look for trends. Make comparisons.
Maybe your conversion rate was 6% coming from Google Adwords. But the Adwords conversion rate for desktop users was 8% versus 2% for smartphones and 4% for tablets. Now you have an understanding of how the device contributes to that channel’s conversion rate, taking the volume into consideration.
And how did that paid search channel breakdown compare to your other channels? For example, smartphone conversion rate maybe 4% from your emails and 1% from social media.
Identify big shifts and changes. Discover anomalies.
Using the Google Adwords example again, maybe starting in July you see an increase from 5% to 7%. And that higher rate seems to have continued for several months.
Then hypothesize. Ask “why?”
That increase in July may have corresponded with an increase in your PPC bids or budget. Or maybe you launched a new set of keywords for a hot brand. You could hypothesize why the increase happened and continued.
This additional lens into your primary segmentation can uncover the root cause. You are now ready to take action with that data-based knowledge in hand.
How to Prioritize Your Optimization Plan
You are armed with lots of data and valuable analysis. You can now more easily prioritize the action you want to take and build an optimization game plan.
Typically you’ll want to pick one to run every quarter. That single-focus test approach helps you isolate the incremental sales and conversion rate you’ve achieved. You also give enough time to achieve improvements, validate the results with enough traffic, and eliminate most anomalies by running the test for a longer period of time like two or three months.
Which tests should you run first?
It’s always good to start with the test you feel can have the biggest financial impact. Estimate the revenue impacts for all the top activity ideas you have identified. How much would sales increase by each incremental tenth of a percent increase in conversion rate?
Then look at the level of effort and investment cost of running the test. If an activity may have a high-revenue upside while requiring little extra work, then you’ve found a great place to start.
Let’s look at some of the highest conversion boosting opportunities you have.
5 Critical Enhancements for Bigger E-commerce Conversion Rate Optimization
The best conversion rate optimization tests consider the customer experience journey. Understand the different interactions from the first moment a shopper lands on your website, through finding and choosing a product, and all the way to checkout and completing the purchase.
You make many different enhancements to your online customer experience. Here are five design improvements proven to increase conversion rates:
1. Win More High-Purchase Intent Shoppers
Arguably one of the best ways to increase your conversion rate is to win more sales from visitors who already have a high intent to purchase. So how do you know that someone comes to your site with the intention of buying?
Shoppers signal their intent when they use your site search.
SLI studies have found visitors that use search buy at a 2.7x greater rate than visitors who just browse.
Make the act of searching even easier by enticing those visitors who have a specific purchase in mind.
Position your search box in the header and in the center of every page. Provide an engaging prompt to search in the search field. And make the box large and distinctive from other forms. Don’t tuck the search box into the corner or hide it behind a magnifying glass icon that searchers have to click.
Speed up the search by suggesting possible terms as visitors start typing the first letters of a keyword. This autocomplete functionality draws from your product feed to indicate that productive search results are available. Better yet, you can rank the autocomplete terms by the most popular keywords by clickthrough and purchase data, not just keyword matching.
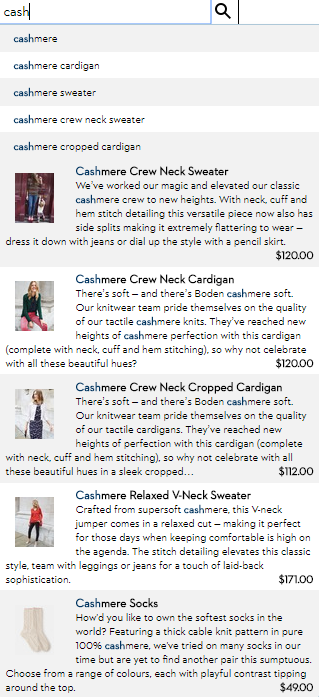
Pro Tip: Enhance your autocomplete feature by presenting specific products in the search suggestions. Display the product name, image, and price for the most relevant products. Boden speeds up the purchase process doing just that.
This enhanced functionality helps your visitors identify products they are looking for even more quickly. Then send them directly to the product page. Skip the extra category page browsing. Bypass the search results page. Get high-purchase intent shoppers directly to a product.
2. Wow Visitors with Visual Merchandising
The key elements of a product landing page are designed to showcase the product so that customers can easily make a purchase decision – product title, descriptions, specs, purchase options, ratings, reviews, and, of course, pricing and discounts.
This product feed information gives shopper the facts. However, we humans actually make purchase decisions emotionally much of the time. Shoppers love the wow factor. That’s where online visual merchandising excels.
e.l.f Cosmetics shows off their eye shadow products with beautiful images and attractive videos from Instagram. These social media images inspire shoppers. Better yet, many of the pictures are user-generated content from customers.

Similarly, fashion sites often display extra images since shoppers can’t actually hold the item in their hands. Visual merchandising best practices, like model videos, product pictures from many angles, and custom images that change with color selection, can help drive more sales.
Pro-Tip: Help customers visualize what their experience will be after they make the purchase. Show action shots and product videos that depict how the product is used, what the buyer gets in the box, or how to install it.
3. Merchandising that “You May Also Like”
The top job of merchandising is to promote the products a visitor is most likely to buy. One of the best online merchandising techniques is to use a “You May Also Like” product recommendation strategy on the product page.
Showing alternative products that are similar to the product being viewed is proven to increase conversion rates.
Unfortunately, many e-commerce sites determine the recommended products using simple category and keyword matching. This approach focuses on the product feed data only.
Fortunately, online stores have massive amounts of behavioral and transactional data in addition to product feed data. “You May Also Like” product recommendations that include actual customer behavior are more likely to convert.
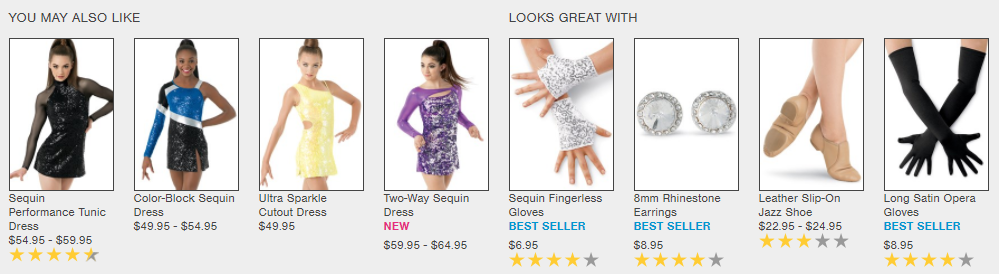
For example, Dancewear Solutions recommends several contemporary dance dresses on a product page. It also merchandises complementary products that go with the dresses based on what customers had made purchases in the past.
Pro Tip: Customers love a personalized shopping experience. In-store salespeople give a personal touch to help customers get exactly what they want. Now artificial intelligence is helping online stores create a similar personal customer experience.
E-commerce personalization uses machine learning to sift through massive amounts of behavioral data to quickly provide smart product recommendations. Contextual personalization can display products that customers are even more likely to buy based on gender, size, brand preference, or the shopper’s location.
4. Help Shoppers Get What They Want Faster
Smart e-commerce companies create as few steps as possible to get to checkout. Customers are more likely to complete their purchase when you allow visitors to add products to shopping carts or go to checkout directly wherever they are on your site.
Don’t limit the use of “Add to Cart” or “Buy Now” buttons to your product pages. Anywhere you merchandise products, even your homepage, is an opportunity for customers to commit to purchasing without an extra click to the product page.
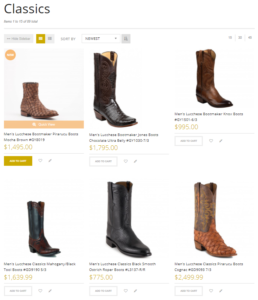
Pro Tip: Include “Add to Cart” button directly in the your category pages and search results pages. That’s what Allens Boots did. This quick enhancement helps speed the conversion, particularly if your customer knows exactly what they want.
5. Eliminate Rational Roadblocks with Content
Don’t rely solely on the product description provided by the manufacturer to influence a buyer. Inform your customers about what a product can do. Offer how-to articles, demo videos, and comparisons against other similar products.
Content has a strong influence on e-commerce conversions both rationally and emotionally. How-to content helps remove rational doubts or questions that make shoppers hesitate. Video content in particular also has an emotional trigger for sales as customers can visualize themselves using the product.
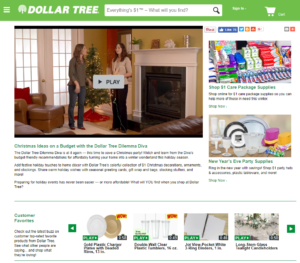
Dollar Tree uses videos to show shoppers curated product ideas and demo top-rated customer favorites.
Pro-Tip: Include a set of Frequently Asked Questions (FAQs) on the product product. Ask your customer service team for questions that they get about the product. Review common reasons for returns. Think of questions you would have if you were going to pay your own hard-earned money. Then create a strong set of FAQs written in the language that customers use.
There are hundreds more conversion-rate tips that you can test. Make sure to download these best practice e-books to find new ways you can improve your conversion rates:
Image Credit: Wikimedia Commons